Public sources
Urn tally reports (BU), voting-machine logs, machine replacement records and voter-profile data, from the TSE Open Data Portal.
 Observatório
A look at how Brazilian elections work. Explore operational indicators, compare results and see the limits of each analysis.
Your contribution helps improve the hardware and expand data processing. Voluntary support, no minimum amount.
Charts and PDF documents are in Portuguese; this page explains them in English.
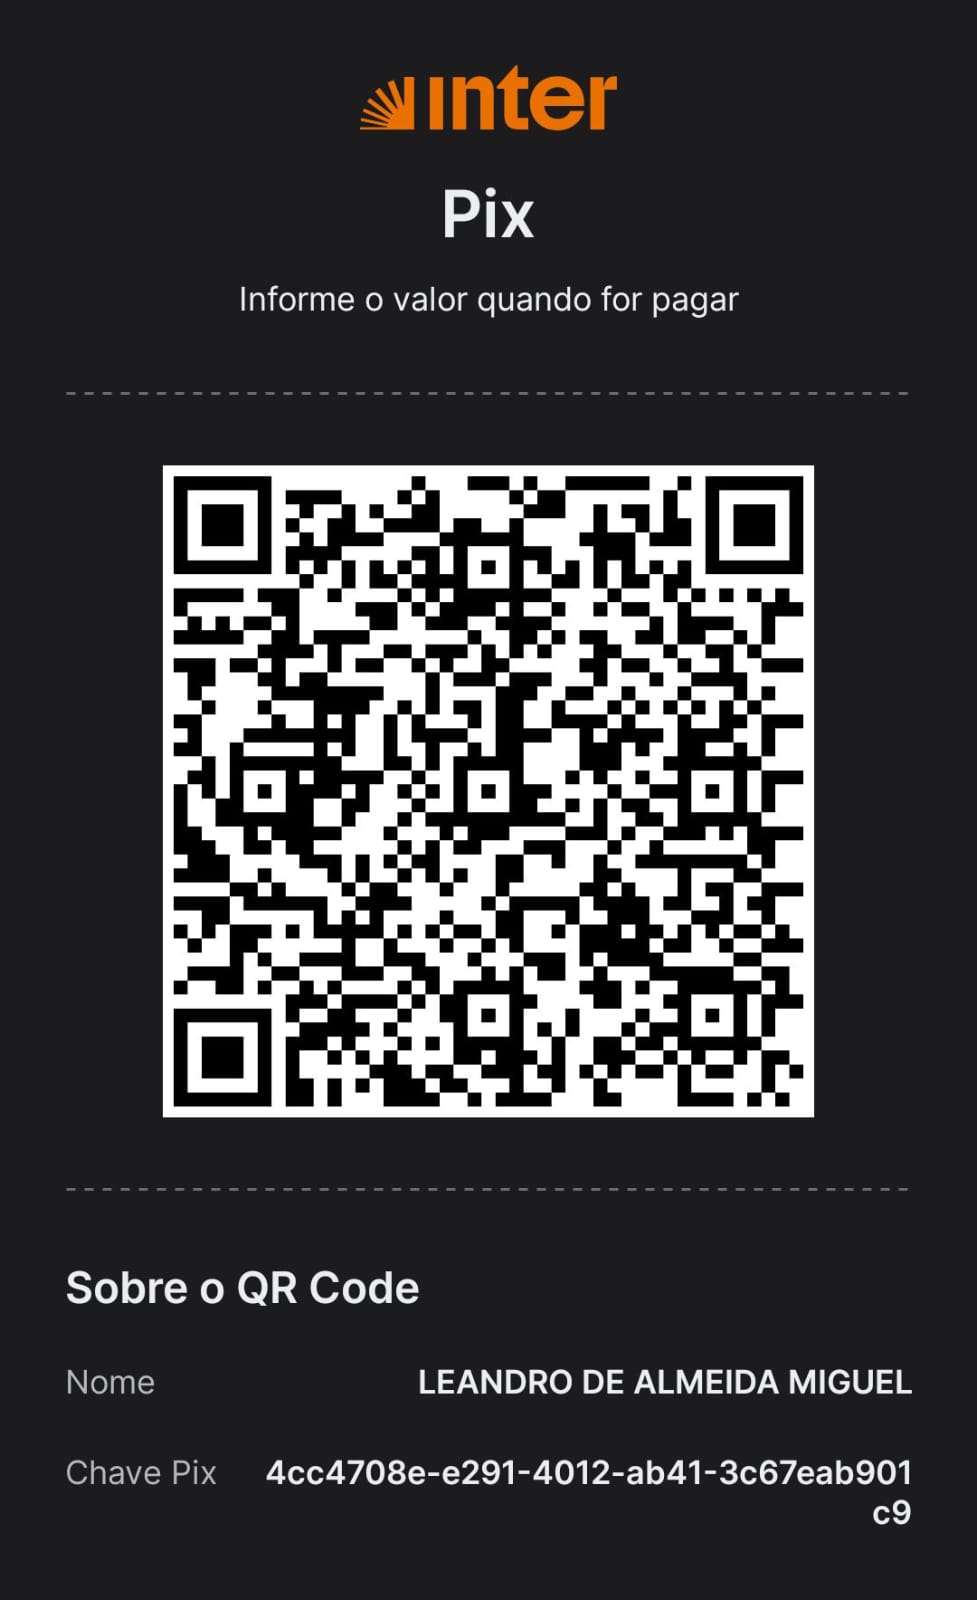
Voluntary contribution, no minimum amount, used to improve the hardware and data-processing capacity. Goal for improvements: R$ 5.000. Pix is Brazil's instant payment system.
4cc4708e-e291-4012-ab41-3c67eab901c9Pix shows the account holder: Leandro de Almeida Miguel. Check the recipient in your banking app before confirming. Contributing is optional; access to data and documents is free.
Transparency from the start. Results are from the edition of 2026-10-24, revised after an external review (see the change log in the technical document, in Portuguese). Indicators do not prove irregularities and do not reveal how late or manually enabled voters voted.
See limitations ↗Pick an election round and examine the indicators of the current edition. Operational categories may overlap.
Side A = PT (president) or the leading mayoral candidate in the municipality. "Above the threshold" = an absolute difference of 5 percentage points or more that also exceeds the normal variation between rooms of the same building (|z| ≥ 2). Another flagged sections have no comparable neighbour and are compared with their municipality, separately (see the technical document).
Choose a state and type part of the municipality name, the polling-place name or the electoral zone number. The list shows polling places with flagged behaviour in at least one election, with observation priority, points and sections to check. Codes and names are the official ones from the TSE (Brazil's electoral court); places without a registered name are shown as such.
Choose a state to start.
| Municipality | Zone | Place | Place name | Priority | Points | Result signal | Flagged sections | Rec. 2+ | Pres. dif. | Direction | Sections to check | Manual enablements 2026 R1 (unassoc.) | Field kit |
|---|
Manual enablements 2026 R1: voters enabled without biometrics in the 2026 first round, summed over all sections of the building; in brackets, how many and what share were authorised by a fingerprint that the voting machine does not associate with a registered poll worker. Reference: 39% in a random sample of 5,000 sections. Values above that usually mean a poll worker whose fingerprint was not registered at opening: a traceability gap, not an improper vote. Computed for high-priority polling places; the field kit (PDF, in Portuguese) lists the sections to check and the observation steps for election day.
The same charts as in the chart notebook (labels in Portuguese). Click to enlarge. The numbers come from the files in the Open data section.
The study combines operational records with aggregated results per polling section. The aim is to raise verifiable questions and support further observation. The score of each polling place is an order of priority for observation, not a probability of irregularity.
Read the technical document (Portuguese) ↗Urn tally reports (BU), voting-machine logs, machine replacement records and voter-profile data, from the TSE Open Data Portal.
The main result compares each section with its neighbours in the same building. Sections without a comparable neighbour are compared with their municipality and kept separate, because the base rate there is different.
Queues, biometrics, infrastructure and the make-up of the electorate can explain the differences. Association does not establish cause. How late voters voted is unknown.
Documents to follow the reasoning and assess the results, in Portuguese. Edition of 2026-10-24.
An introduction to the question, the scope and the limits.
Plain summary 03 pagesVISUALISATIONS · PDF (PT)Twelve charts with reading guidance.
Chart notebook 12 pagesIN DEPTH · PDF (PT)Definitions, coverage, tests, scoring, limits and change log.
Method and data 07 pagesTables by election, comparison level, polling place and zone.
Scan 12 pagesOPERATIONAL · PDF (PT)Overview of the states; maps by state in the data package.
General map 07 pagesSTUDY · PDF (PT)Eight indicators, direction tests and an observation tool.
Inconsistencies 12 pagesOrganised datasets to query, reproduce and propose improvements without repeating the whole collection. CSV files use a semicolon separator and a comma as the decimal mark; column names are in Portuguese and a field dictionary is included. Everything derives from public TSE data and is licensed CC BY 4.0: use, adapt and redistribute citing the source and keeping the notice that a flag is not an accusation.
Download summary by election ↧Code and reproduction: https://github.com/Leandro-VPN/observatorio-do-voto. The raw data (urn tally reports, voting-machine logs, machine records and voter profile) are public at the TSE and are downloaded by the repository scripts.
Flagged × unflagged, by election and level (place / few pairs / municipality)
Rates with denominators; see also pres-x-pref-mesmas-secoes.csv (McNemar)
Probability of repeating the behaviour across elections, among sections present in both
Sections, logs, votes after 5 p.m., manual sequences, counts per indicator
By file and column: type, % missing, example and description (in Portuguese)
Definitions of behaviour, comparison, threshold, scoring and priority (in Portuguese)
File format and sample DuckDB queries, including joins that do not double-count turnout (in Portuguese)
One row per section: last vote and closing history, manual enablements by type (2026 R1), what to observe and blank columns for notes on the day
Places with score and reasons, 2026 R2 priority, history by section, sections by election · GitHub Release dados-2026-10-24-r2
Places, checklist per section, zones; general and per-state PDF and Excel · GitHub Release dados-2026-10-24-r2
VARREDURA_LOCAIS.xlsx and LOCAIS_<UF>.xlsx · GitHub Release dados-2026-10-24-r2
One row per section: BU, log, profile, indicators, side A/B · GitHub Release dados-2026-10-24-r2
One row per section: BU, log, profile, indicators, side A/B · GitHub Release dados-2026-10-24-r2
One row per section: BU, log, profile, indicators, side A/B · GitHub Release dados-2026-10-24-r2
One row per section: BU, log, profile, indicators, side A/B · GitHub Release dados-2026-10-24-r2
One row per section: BU, log, profile, indicators, side A/B · GitHub Release dados-2026-10-24-r2
Everything the site generator reads (CSVs, PDFs, charts); restore with scripts/restore_edicao.py · GitHub Release dados-2026-10-24-r2
SHA-256 of each package, parameters, inputs and producer code of the edition
Voluntary support to improve the hardware and processing capacity. Goal for improvements: R$ 5.000. No minimum amount.